Catégorie : DATA VISUALPage 1 of 2
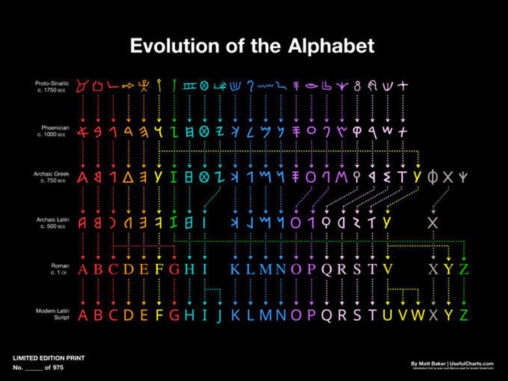
«Matt Baker of Useful Charts creates helpful visual guides that condense hundreds, and sometimes thousands, of years of history into streamlined flowcharts. His poster Evolution of the Alphabet looks at…
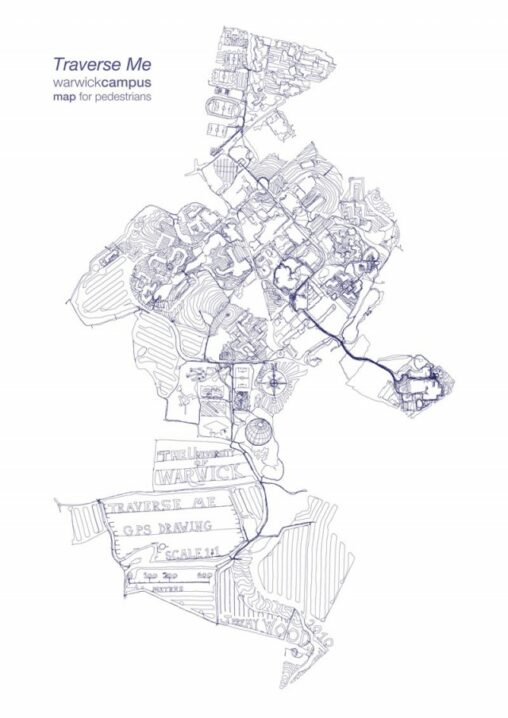
«… Cultures numériques, Data, Design d’information, Représentations citoyennes, Communs Designer et chargée de recherche à la Cité du design de Saint-Étienne, je porte des projets dédiés à la…
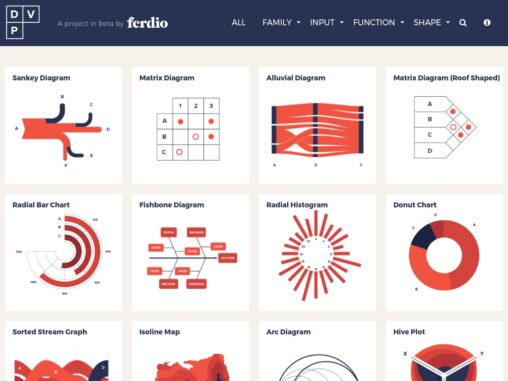
This is a website trying to present all relevant data visualizations, so you can find the right visualization and get inspired how to make them. http://datavizproject.com

Actualités de l’atelier de Didactique visuelle de la Haute école des arts du Rhin à Strasbourg et de son programme de recherche Didactique tangible. www.didactiquevisuelle.hear.fr https://www.facebook.com/didactiquevisuelle/
L’alliance du fond et de la forme, c’est le credo de WeDoData sur tous ses projets. A partir de jeux de données (existant ou à créer), son équipe…